李金成 韩令海 曲函师 姜明慧 王永军

Research on Diversified Technical Routes for Passenger Car Powertrains Based on Dual Carbon Strategic Goals
Li Jincheng, Han Linghai, Qu Hanshi, Jiang Minghui, Wang Yongjun
(Global R&D Center, China FAW Corporation Limited, Changchun 130013)
【Abstract】The strategic objectives of "carbon peaking" and "carbon neutrality" have brought significant challenges for reducing carbon emissions from passenger cars. Therefore, formulating a technical route for carbon reduction in passenger vehicles is a crucial task for the future sustainable development of the automotive industry. Firstly, it involves analyzing data on new passenger car production, stock and scrap rate up to 2060, as well as carbon intensity data of electricity industry. Subsequently, the carbon emission data from various power sources for passenger cars is compiled. An analysis model is then established, along with evaluation dimensions and indicators, to assess passenger cars with different power sources. Finally, the analysis focuses on the sensitivity of individual power technologies in reducing carbon emissions. The findings indicate that pure electric vehicles (EVs), plug-in hybrids (PHEVs), and hybrid electric vehicles (HEVs) play a pivotal role in rapidly reducing carbon emissions to achieve "carbon peaking". Additionally, carbon-neutral fuel power and fuel cell vehicle technologies demonstrate advantages in achieving "carbon neutrality". In conclusion, achieving "carbon peaking" and "carbon neutrality" in powertrains requires a combination of multi-source technology pathways within specific timeframes for implementation. Furthermore, transitioning policies and regulations from "double credit" to"carbon credit" based on technology neutrality is essential to realize the dual-carbon technical route for passenger cars.
Key words: Carbon peaking, Carbon Neutrality, Powertrain, NEV, Technical Route
【欢迎引用】 李金成,韩令海, 曲函师,等. 基于双碳战略目标的乘用车动力总成多元化技术路线研究[J]. 汽车文摘,2024(XX): 1-11.
【Cite this paper】 LI J C, HAN L H, QU H S, et al. Research on Diversified Technical Routes for Passenger Car Powertrains Based on Dual Carbon Strategic Goals[J]. Automotive Digest (Chinese), 2024(XX):1-11.
【摘要】“碳达峰”与“碳中和”战略目标为乘用车减碳带来巨大挑战,因此制定乘用车减碳技术路线是未来汽车产业可持续发展的战略任务。首先,分析从现在到2060年乘用车新车产量、存量和报废率数据以及电力行业碳排放强度数据。然后,梳理了乘用车不同动力源碳排放数据,建立不同动力源乘用车碳排放分析模型、评价维度和评价指标。最后,分析了单一动力技术减碳敏感性。结果表明,纯电动汽车、插电式混合动力汽车和混合动力汽车技术在快速降低乘用车碳排放实现“碳达峰”进程中扮演重要角色,碳中性燃料动力和燃料电池汽车技术在实现“碳中和”进程中更具有优势。研究认为实现“碳达峰”和“碳中和”动力总成需要多源化技术路线组合及相应的技术导入窗口期,基于技术中立的从“双积分”到“碳积分”政策法规的转变是实现乘用车“双碳”技术路线的重要保障。
关键词:碳达峰;碳中和;动力总成;新能源汽车;技术路线
中图分类号:U461.8; U469.72; 文献标志码:A DOI: 10.19822/j.cnki.1671-6329.20230279
Abbreviation
EV Electric Vehicle
HEV Hybrid Electric Vehicle
PHEV Plug in Hybrid Electric Vehicle
FCV Fuel Cell Vehicle
CAFC Corporate Average Fuel Consumption
PC Passenger Car
CCUS Carbon Capture, Utilization & Storage
ICE Internal Combustion Engine
H-ICE Hydrogen Internal Combustion Engine
N-ICE NH3 Internal Combustion Engine
SOC State Of Charge
REEV Range Extend Electric Vehicle
BTE Brake Thermal Efficiency
0 Introduction
As greenhouse gas emissions especially CO2 emission continue to rise in recent decades, climate change has become an increasing major concern among the large economies of the world. In 2021, the total carbon emissions made by human being exceeded 36.3 Gt worldwide[1], carbon emissions from China reached 10 Gt[2] . "Carbon Peaking" and "Carbon Neutrality" have become the common social responsibility of the world and will reshape the landscape of energy-related industries. As such, the transport sector, especially in China, is likely to be one of the most affected sectors.
Transportation sector in China, like many other sectors including commercial vehicles and passenger cars, plays an essential role in reaching the carbon peaking and carbon neutrality goals nationwide as automotive industry has been growing with booming economy. To address dual carbon strategic goals in the transportation sector, especially for passenger cars, automotive industry across the country has continuously made solid efforts developing a wide variety of powertrains and electric drive systems for energy-saving vehicles and New Energy Vehicles (NEVs) [3], including Hybrid Electric Vehicles (HEVs),Plug in Hybrid Electric Vehicles (PHEVs), Electric Vehicles (EVs) and Fuel Cell Vehicles (FCVs). Currently, thanks to the plenty of dual carbon related policies at the national level, variety of technical routes for powertrains and electric drive systems of low carbon vehicles and zero emission vehicles, which contribute a great deal to a low carbon society in China, have come into being exist. In the meantime, low carbon fuels and carbon neutral fuels are also under intense research for future application to contribute to low carbon powertrains. Chinese NEV market continues to grow with penetration rate of 29.5% in 2023, and dominate the NEV market around globe[4].
In such context of complex, diversified powertrains and electric drive systems both for energy saving vehicles and NEVs, it is necessary to quantitative evaluate the individual powertrain and electric drive system technology and to obtain in-depth comparison and understanding for different powertrains and electric drive system technologies within the same boundary conditions, in terms of carbon peak value, cumulative carbon emission value, carbon reduction rate and carbon neutral value.
This paper analyzes the data of current stock, production as well as scrap rate of Passenger Cars (PC) up to 2060, utilizing the carbon emission intensity data of the electric power generation industry, bringing the deep insight into the carbon emission data of passenger cars with diversified powertrains. To perform in-depth analysis passenger car carbon emission, an analysis model with diversified powertrains, evaluation dimension and evaluation index are created so as to analyze the decarbonization sensitivity of individual powertrain technologies.
1 Carbon Emission Targets for Passenger Cars
According to research of the Institute of Climate Change and Sustainable Development in Tsinghua University, Chinas peak carbon emissions in 2030 are estimated to be around 11 Gt, a 10% increase from 2020. By 2060, carbon-neutral emissions are expected to be 2 Gt, decreased by 82% compared to 2030[5], as shown in Fig. 1.
As a significant source of carbon emissions, the automobile industry must achieve carbon peak and neutrality targets of 10% and 82% of total carbon emissions by 2030 and 2060, respectively. The annual carbon emissions from the transportation sector in China are currently about 1 000 Mt and are projected to reach 1 100 Mt by 2030. If the rate of carbon emission reduction in the transportation sector matches that of the entire country, annual carbon emissions are projected to decrease from 1 100 Mt to 200 Mt between 2030 and 2060. The overall carbon emission budget is about 30.6 Gt, as shown in Fig. 2.
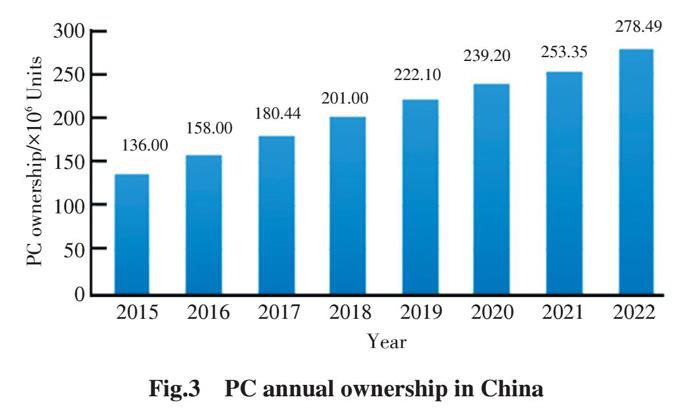
The PC sector in China exhibits similar trends. According to the data from the National Bureau of Statistics, in 2022, PC ownership in China reached 278 million units[6], an increase of 105% compared to 2015, as shown in Fig. 3.
In the meantime, the overall gasoline consumption increased by only 22.7%, from 95 Mt in 2015 to about 110 Mt after 2018, as shown in Fig. 4. The carbon emissions based on the fuel used amount to about 340 Mt over 5 consecutive years (Fig. 5). The total carbon emissions in the vehicle use stage reach about 410 Mt when considering the carbon emissions from the fuel production cycle. Carbon emission of PC sector is up to peak.
If the carbon emissions from the manufacturing cycle and electric vehicles are combined in a given year, the total carbon emissions amount to about 590 Mt, steadily increasing and projected to reach 650 Mt by 2030. If the PC sector also follows the same decreasing speed as the overall transportation sector, carbon emissions will decrease to about 130 Mt in 2060, achieving carbon neutrality. The overall carbon emission budget is approximately 18.3 Gt, as shown in Fig. 6.
To achieve the above targets, the first challenge for the PC sector is how to reach carbon peak before 2030. By 2020, the number of PC ownership in China had already reached 240 million units. By 2030, PC ownership is expected to increase to 350 million units, reflecting a 46% increase as illustrated in Fig. 7.
Fig. 7 shows that PC ownership is still increasing. Even if EVs are rapidly introduced from now on and ICE car production is completely stopped in 2030, the ownership share of ICE cars will still be more than 58%. Therefore, to achieve carbon neutrality the increasing overall ownership of PCs, the growth of new car production, and the continued ownership of ICE cars pose a significant challenge for the automotive industry in China.
Fig. 6 shows that in order to achieve carbon neutrality, the overall PC market, including used and new cars, must reduce carbon emissions by about 17.3 Mt each year starting from 2030. This implies that approximately 14 million units of used cars would need to be scrapped without any new car production. This is a significant challenge, especially when considering that the current annual production volume of passenger cars is about 20 million units in China. Achieving carbon neutrality appears to be very challenging under these circumstances. Thus, a quantitative analysis of various PC powertrain technical routes is necessary to determine the most appealing technical routes.
2 Boundary Condition Settings and Analysis Modeling
In order to obtain credible analysis results, reasonable boundary conditions have to be set up in advance. All the boundary conditions are based on current real PC market sales data and authoritative predictive data for future market, but relatively conservative data are used.
The first boundary condition is the prediction on future PC sales volume[7], shown in Fig. 8.
According to Fig.8, the maximum annual PC sales volume is projected to reach about 25 million units in 2040, after which the sales volume will stabilize. This prediction is somewhat conservative compared to the most radical estimate of about 40 million units in annual PC volume, but it is the most reasonable forecast considering the current situation. Besides, conservative predictions can provide a more fundamental technical route compared to radical predictions, which may require additional decarbonization solutions such as Carbon Capture, Utilization & Storage (CCUS), exceeding the capabilities of the vehicle industry. Fig. 9 shows the boundary condition of the annual scrap ratio of ownership vehicles.
Fig.9 shows that the current scrap ratio is only about 1%, which is relatively low compared to advanced automobile markets like America, Europe, and Japan, where it typically ranges from 5% to 7%. But with the rapid development of the Chinese PC market, we predict that the scrap ratio will reach about 5.5% by 2040 and then stabilize.
Fig. 10 displays the forecast of annual total PC ownership, which is based on current PC ownership, annual production volume, and annual failure rate. Fig. 10 shows that the maximum overall PC ownership will increase from 240 million units in 2020 to about 450 million units in 2038. Afterward, PC ownership is expected to stabilize[7].
One of the most important boundary conditions is the mean carbon emission intensity of the electricity industry. As a matter of fact, this boundary condition will determine the overall speed of carbon emission reduction from a manufacturing perspective. It will not be influenced by the automobile industry itself, but rather by the power generation industry. The proportion of renewable energy in power generation will play the most crucial role. As shown in Fig. 11, the predicted average carbon emission reduction rate is about 13 g/kW·h each year, which is expected to increase from about 2% in 2021 to 9% in 2060[8].
Because carbon emissions in the manufacturing process play a significant role from a life cycle perspective, it is necessary to establish a starting point for carbon emissions in the manufacturing cycle of various types of vehicles, including ICE, EV, PHEV, FCV, and carbon-neutral ICE vehicles (especially hydrogen ICE vehicles). The starting point is 2020. The carbon emission reduction rate after 2020 is defined to be the same as the carbon reduction rate of the power generation industry, starting at 2% in 2021 and increasing to 9% by 2060. Fig. 12 shows the starting point of carbon emissions in the manufacturing cycle of various types of vehicles.
Other assumptions for this quantitative analysis are as follows:
(1) Carbon emissions from the scrap cycle are not included. This is because the current scrap ratio is still very low, so there is no accurate data that can be used.
(2) Carbon emission data from the vehicle manufacturing cycle are used as current emission data and should not be averaged over the vehicles life cycle. This assumption is also reasonable. When a car is rolling out of the production line, the carbon emissions for this car are also generated at the same time.
(3)The carbon emission reduction rate for the manufacturing cycle and fuel production is set to be the same as the carbon reduction rate for the power generation industry.
(4) The carbon emissions from the combustion of 1 kg of gasoline are 3.16 kg.
Based on the above boundary conditions and assumptions, an analysis model is set up, as shown in Fig. 13.
3 Quantitative Analysis of Technical Route for Individual PC Powertrain
The purpose to do individual PC powertrain technology analysis is to obtain very clear relative comparison results under the premise of the same boundary condition, the absolute analysis results will vary along with the variation of the boundary conditions.
There are 4 evaluation indexes utilized for the quantitative analysis, including carbon peak value, cumulative carbon emission value (carbon budget), rate of reduction and carbon neutral value, shown in Fig. 14.
3.1 Pure ICE Technical Route
It is common knowledge that a pure ICE technical route cannot achieve carbon neutrality because it relies on fossil fuels. However, it can serve as a foundation for quantitative analysis in other technical routes. Fig. 15 shows the analysis results of the ICE technical route. The carbon peak value in 2030 is 649 Mt, almost the same as the peak value target shown in Fig. 6. The overall cumulative carbon emissions are about 24 Gt, which is approximately 31% higher than the target of 18.3 Gt. The carbon neutral value is 467 Mt, which is 359% of the target value. The annual carbon emission reduction rate is only 5.9 Mt, whereas the required value is 17.3 Mt.
As a result, the ICE roadmap can only achieve the carbon peak target, while all other targets cannot be met.
3.2 Carbon Neutral ICE Technical Route
A new assumption for carbon neutral ICE technical route is that it will be introduced starting in 2025 and is projected to reach 80% of the overall ownership by 2050. Additionally, it is anticipated that 20% of fossil fuel will still be utilized after 2050. Please refer to Figure 16 for details. Considering that additional development is necessary compared with a pure ICE technical route, the vehicle cycle carbon emissions have increased from 7.5 t to 8 t. Simultaneously, the carbon emissions from carbon-neutral fuel production have also increased by 20%.
Based on above assumptions, the analysis results of carbon neutral technical route are shown in Fig. 17.
Fig. 17 indicates that carbon neutral ICE technical route can achieve all the carbon targets outlined in Fig. 6. The premise to achieve a carbon-neutral ICE technical route is to secure an adequate supply of carbon-neutral fuel. This primarily depends on renewable electricity generation and carbon capture technologies. Consequently, carbon-neutral fuel is anticipated to be more costly than fossil fuel initially. However, the cost can decrease as renewable electricity generation capacity rapidly expands.
Furthermore, the greatest benefit of the carbon-neutral technical route is that it allows for the retention of current development and production capabilities, as well as gas stations, thereby avoiding significant carbon emissions. Consequently, it represents a promising technical route.
3.3 Hydrogen ICE Technical Route
Hydrogen is an ideal fuel from the perspective of combustion speed and carbon emissions. However, on the flip side, it poses challenges in terms of storage. Additionally, there will still be some NOx emissions when the engine is running in lean combustion mode. Hydrogen storage in passenger cars is crucial because high-pressure hydrogen tanks are not only more expensive but also take up a lot of space.
If hydrogen ICE is introduced starting in 2030 and the proportion of hydrogen ICE reaches 100% by around 2045, as shown in Fig. 18, the carbon emissions from vehicle manufacturing cycles will increase from 7.5 t to 9.5 t. When factoring in the current expensive high-pressure tank, the analysis results are presented in Fig. 19.
Fig. 19 shows that compared with the carbon-neutral ICE technical route, the hydrogen technical route can achieve a carbon-neutral value of 61 Mt, which is even lower than that of the carbon-neutral fuel technical route. Additionally, it can meet the targets of carbon peak value and carbon accumulation value.
The main issue with the hydrogen ICE technical route is that the carbon reduction value exceeds the target, especially in the short and medium term before 2040. This is primarily due to the high cost of the high-pressure hydrogen storage tanks.
3.4 HEV Technical Route
Here, HEV refers to vehicles equipped with a specially developed hybrid engine with Brake Thermal Efficiency (BTE) exceeding 41% and a dedicated hybrid transmission with 2 or more electric motors for electric generation, driving the wheels, or energy recuperation. Compared to pure ICE vehicles, HEVs consume 30% to 40% less fuel. The carbon emissions from the vehicle manufacturing cycle are set at 8.5 t/Unit, which is 1 t higher compared with pure ICE vehicle.
The market share variation of HEV versus ICE is illustrated in Fig. 20.
Based on above boundary conditions, the analysis results of HEV technical route is shown in Fig. 21.
Fig. 21 shows that the carbon neutral value is 320 Mt, which is 251% of the target. At the same time, the accumulated carbon emission is 20.3 Gt, which is 111% of the target, thus HEV is not suitable for carbon neutral technical route.
But Fig. 22 shows that HEV technical route can reduce about 40% carbon emission before 2043 compared with ICE technical route, only after 2043 the reduction speed will be reduced. This means before 2043 HEV technical route is also a suitable solution.
3.5 PHEV/REEV Technical Route
The definition of PHEV and REEV is that the vehicle will run in EV mode (high SOC mode) for 80% of the mileage with fleet-averaged electricity consumption of 15 kW·h. When the vehicle runs in PHEV or REEV mode (low SOC mode) for the remaining 20% of the mileage, the fleet-averaged fuel consumption is 5.5 L/100 km, which is reduced by more than 35% compared to that of an ICE vehicle, as shown in Fig. 23. In the meantime, 20% of fossil fuels will be reserved until 2060.
The market share introduction pace is set to align with the HEV technical route, as shown in Fig. 20. Based on the above boundary conditions, the analysis results of PHEV and REEV technical routes are shown in Fig. 24.
Fig. 24 shows that all targets can be met well except for the carbon neutral value of 180 Mt, which exceeds the target of 130 Mt. Particularly, the accumulated carbon emission of 17.7 Gt is lower than the target of 18.3 Gt, thanks to the faster carbon emission reduction rate of 19.5 Mt/year compared to the target of 17.3 Mt/year. Considering that in this analysis, there are still 20% fossil fuels left until 2060 and it is possible to replace the fossil fuels with carbon-neutral fuel before 2060, the PHEV and REEV technical routes can be a realistic and practical carbon-neutral technical route.
3.6 EV Technical Route
The market share introduction pace of EV technical route is set to be the same as HEV technical route, as shown in Fig. 20. Based on all defined boundary conditions, the analysis results of EV technical route are shown in Fig. 25.
Fig. 25 shows that the EV technical route is almost capable of meeting the carbon-neutral targets. However, the peak value and neutral value are slightly higher than the targets. But compared with the PHEV and REEV technical routes, the EV technical route does not have an obvious advantage. The carbon peak value and carbon accumulation value are even higher than those of the EV technical route. This is mainly due to the higher vehicle manufacturing cycle carbon emissions of EVs compared to PHEVs and REEVs.
Fig. 26 and Fig. 27 separately illustrate the carbon emissions during the vehicle manufacturing cycle and the vehicle using cycle for the technical routes mentioned above.
Fig. 26 illustrates that the challenge of EV technical route lies in the higher vehicle cycle carbon emissions, particularly before 2043. At the cycle side shown in Fig. 27, the carbon emission levels of EVs, PHEVs, and REEVs are almost the same before 2043. The advantage of EVs only becomes apparent after 2043, despite the smaller difference. From this perspective, both EV and PHEV, as well as REEV technical routes, are excellent. Battery technology will determine which one performs better, although the battery technology itself remains uncertain.
3.7 FCV Technical Route
Because the FCV technical route still has some uncertainty compared to HEV, PHEV, and EV, the introduction pace of FCV is set to be a little slower. It is projected that only after 2052, all vehicle models in the market can be 100% FCV, as shown in Fig. 28.
Another important assumption is that all the hydrogen is produced by green electricity, but the electricity used in the vehicle cycle is a mixture of green and fossil fuel-based electricity.
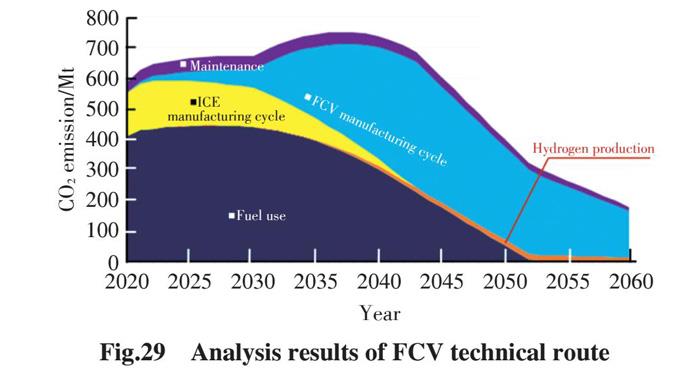
Based on the above assumption and the assumption of carbon emissions from the manufacturing cycle in Fig. 12, the analysis results of the FCV technical route are derived and shown in Fig. 29.
Fig. 29 shows that the most significant difference between the FCV technical route and other technical routes is the very high vehicle manufacturing cycle emissions of the FCV technical route. This directly results in a peak value of 745 Mt, which is 15% higher than the target. The cumulative carbon emissions are 22.5 Gt, which is 23% higher than the target. The carbon-neutral value is 166 Mt, which is 28% higher than the target. Reducing carbon emissions from the vehicle manufacturing cycle is a key issue, and lowering system costs is of utmost importance.
If the vehicle manufacturing cycle emissions of FCVs are reduced to the level of EVs, the results will change significantly, as shown in Figure 30. This suggests that FCVs could be the best technical route if system costs can be controlled, thereby keeping vehicle manufacturing cycle emissions in check. Due to the remaining uncertainties surrounding both fuel cell systems and hydrogen storage technologies, as well as the high costs involved, FCVs are currently viewed as a promising but still uncertain technical route.
4 Results and Discussion
Based on the quantitative analysis of various PC powertrain technologies for carbon peaking and carbon neutrality, a summary can be derived, including the carbon peak value, cumulative carbon emission value, and carbon neutral value, as illustrated in Fig. 31, Fig. 32 and Fig. 33.
Fig. 31 shows that the carbon peak values of different technical routes are almost identical, with the exception of FCV, which is slightly higher. This is mainly because ICE vehicles will still dominate the market around 2030 regardless of the technical route adopted. Hence, from a carbon peaking point of view, no technical route has an obvious advantage.
Fig. 32 shows a comparison of the cumulative carbon emissions from various technical routes. Except for ICE and HEV technical routes, all other technical routes can meet the cumulative target requirement. Therefore, multi-technical routes are reasonable from both risk mitigation and resource utilization perspectives.
Fig. 33 shows that, except for ICE and HEV, all other technical routes have the potential to achieve carbon neutrality if the vehicle manufacturing cycle emissions of FCV are controllable, a scenario that is highly feasible in the future.
5 Conclusions
Based on above quantitative analysis of various powertrain technical routes, the following conclusions are summarized as below:
(1) The significant ownership of pure ICE cars poses the most substantial challenge to carbon reduction in short and medium term. The greatest opportunity lies in decreasing ICE car ownership by implementing a combination of various technical routes, fostering healthy competition, and promoting coexistence.
There is no technical route with absolute advantages; different technical routes have a certain degree of uncertainty.
(2) PHEV, REEV and BEV have established themselves as reliable technical routes, and the current stage of development should be maintained for the long term.
(3) HEVs still have the potential to reduce carbon emissions in the short and medium term. However, the key question is whether it can establish a performance-price ratio advantage over ICE cars.
(4)The carbon-neutral fuel technical route has excellent potential for reducing carbon emissions. Its overall social efficiency may be the highest among existing industrial resources.
(5) Government policies based on carbon credits and technology neutrality are strong guarantees that drive the automotive industry to achieve the above goals.
References
[1] IEA. Global Energy Review: CO2 Emissions in 2021 Global emissions rebound sharply to highest ever level[EB/OL]. (2022-03)[2023-11-01]. https://iea.blob.core.windows.net/assets/c3086240-732b-4f6a-89d7-db01be018f5e/GlobalEnergyReviewCO2Emissionsin2021.pdf.
[2] GUO S Y, LIU W Q, ZHAO W D. Adjusting Industrial Structure and Reducing Carbon Emission Intensity: International Comparison and Experience Enlightenment[J]. STRATEGIC STUDY OF CAE,2021, 23(6): 22-32.
[3] China SAE. Technology Roadmap For Energy Saving and New Energy Vehicles 2.0[M]. Beijing: China Machine Press, 2020.
[4] CAAM. Automotive industry production and sales [2023-09-01](2023-10-24). http://www.caam.org.cn/chn/4/cate_30/con_5236151.html.
[5] HE J K, LI Z, ZHANG X L, et al. Comprehensive Report on Chinas Long-term Low-carbon Development Strategies and Transformation Path ways[J]. China Population, Resources and Environment (Chinese), 2020, 18 (4): 263-295.
[6] National Bureau of Statistics.Statistical Bulletin of the Peoples Republic of China on National Economic and Social Development for 2022[EB/OL]. (2023-02-28)[2023-11-07]. http://www.stats.gov.cn/ztjc/zthd/lhfw/2023/hgjj/202302
/t20230228_1919000.html.
[7] Automotive Data of China Co., Ltd. China Automobile Low Carbon Action Plan(2022)[M]. Beijing: China Machine Press, 2022.
[8] CHINA ELECTRICITY COUNCIL. China Power Industry Annual Development Report 2023[EB/OL]. (2023-07-07)[2023-11-08]. https://cec.org.cn/detail/index.html?3-3226
25.
(责任编辑 明慧)